Pagina Inhoud
![]()
This study represents a guideline how to effectively support the energy decisions making process during the systems design and engineering process. There have been focused on the early design phase to guide the process from the very beginning. It can be used for all kind of energy related systems which have the tendency to be equipped with sustainable energy sources. By using a prediction model for quantifying design decisions, it is possible to guide the design and engineering process. In this model, environmental characteristics will be combined with physics and equipment efficiency factors to generate energy source patterns.
Solar, wind, extracted and grid energy are possible to be simulated in this prediction model. Patterns of the energy sources will be compared with the system energy consumption to predict the energy balance and to estimate the need for energy storage. By using these modeling capabilities, it is possible to estimate the system decision criteria which are now of added value already from the beginning of the design process. The model is validated and is applicable during the early design phase of system design and engineering projects and innovations.
Systems Engineering, Energy patterns, Energy supply, Prediction of behaviour, Energy consumption, Sustainability.
![]()
Thesis Supervisors
1. Introduction
During During the design of systems, sustainable energy sources are of increasing importance. To make decision during the early phases, prediction of system behaviour is necessary. These ‘Design in harmony’ capabilities combine energy supply sources patterns with energy consumption patterns to predict the behaviour of a system in an environment. This investigation is about combining physics with technology for supporting the design and engineering of systems. As was described in the ‘Integrated design and Engineering domain’ (Zaal, 2009) disciplines, life cycle and functional thinking should be integrated for efficient design capabilities.
2. Asset Management
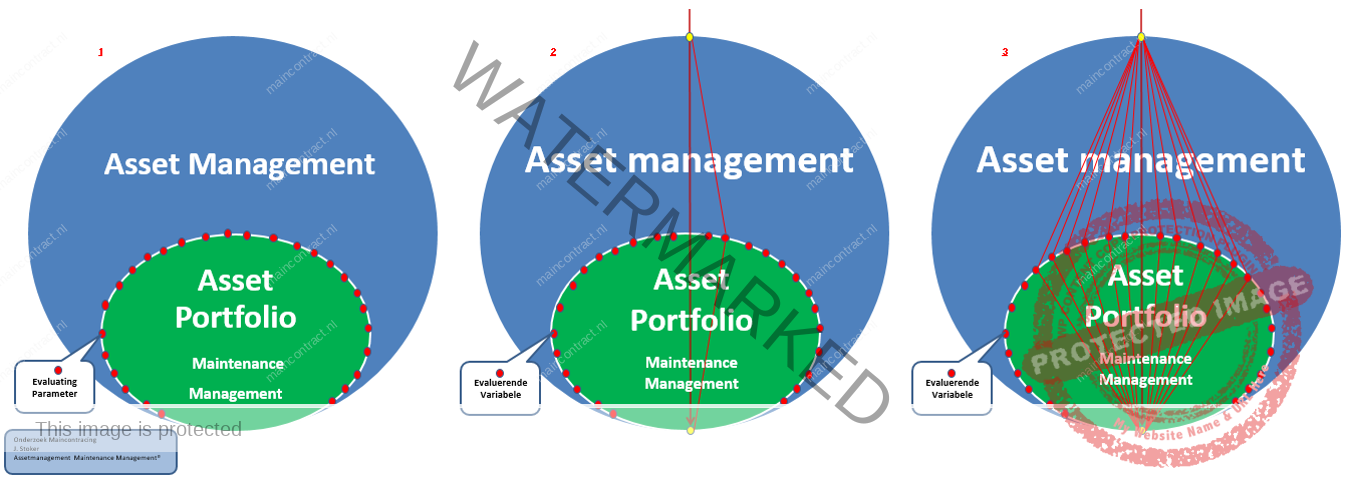
As was confirmed by many investigators Asset Management, as described in ISO55000 and PAS55, contains the organizational foundation to ensure proper value of the assets.
Click to enlarge. Article; Line of Sight : Deepening the subject
Not only during the usage phase but also to be used as an input for the design of new assets. In case of energy intensive assets, the organizational plans and objectives regarding the management of future energy consumption and supply should be part of the Strategic Asset Management Plan which are aligned to the corresponding organizational policies. The Energy Asset Policy (EAP) is a newly introduced term which should be part of the Asset Management Policy (AMP). The EAP is just like the AMP based on the organizational plans and objectives and describes the energy reduction, own supply or footprint related objectives. This is the input needed for the design of new systems.
Click to enlarge. Article; Line of Sight : Deepening the subject
3. Criteria for decision making
To make proper decisions during system design and engineering processes decision criteria are of importance. The following criteria are broadly used to make investment decisions during the early design process:
- Investment
- Life cycle costs
- Life cycle impact
- Amount of sustainable or own energy
Examples of the Life cycle impact that an asset has on the environment are the emission of CO2, NO2, SO2, CO, toxic materials, fine particles, visual sight pollution etc. Currently, the CO2 emission is the only usable criteria which is broadly used for systems design. For sustainable or own energy, it is in some cases needed to comply with the AMP, regulations or authorities.
4. Sustainable energy sources
With the current technology, it is possible to use several types of sustainable energy sources in the same system. Unfortunately, every source has his own behavior and should be used according the systems function and environmental conditions for obtaining the best results. Commonly used sustainable energy sources are wind, solar, geothermal and air-source and will be compared to grid energy by using the criteria for decision making. Geothermal, air-source and thermal energy from other sources can be combined to extracted energy, because it uses the same principal. During the early design phase, detailed information for the decision criteria are not available, therefore mean values should be used for start-up criteria. There must be separated sources applicable for electricity and heating/cooling systems, because they influence the criteria differently. Also important is the steering mechanism, which can be operator (geothermal, air-source) or environmental (wind, solar) steered. To predict the behavior of systems regarding energy supply the energy source physics and equipment efficiencies should be related to the estimated demand.
5. Wind Energy
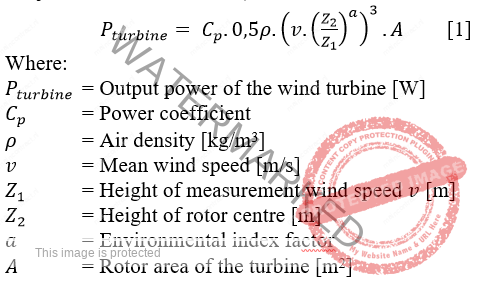
Wind turbines have become a major source of sustainable energy. Unless there is a lot of commodity wind energy has the potentials to grow rapidly. Compared to the sun this energy source has a more even spread energy output. Due to the usage of rotating equipment, maintenance is required to ensure the function can be fulfilled over time. As described in Betz’s law the theoretical maximum ‘power coefficient’ (Cp-max) which can be obtained from the wind is 0,593. For predicting the obtained energy over time there is needed a ‘wind to energy’ transformation calculation. The wind history database obtainable from weather stations provides hourly wind speed ( ) measured at a certain height ( ) above ground level. To translate this to the wind speed ( ) on the axle height ( ) of the wind turbine above the ground, the following equation (Ouwehand, Papa, Gilijamse, & de Geus, 2005) can be used:
The environmental index factor ( ) depends on the surrounding wind blocking elements and ground flatness and will be between 0,12 and 0,35. The power coefficient ( ) fluctuates with the wind speed. For the early design phase, there can be used mean efficiency values of commonly used wind turbines.
6. Solar Energy
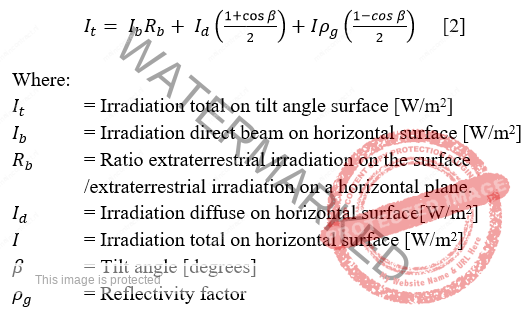
To predict the behaviour of energy supplying equipment obtained from the sun there are a lot of factors which influence the energy outcome. The position of the sun, obstructions, angle of the equipment and equipment efficiency rates. The best way to start a simulation is using the climate data obtained from weather stations, as was also previously performed with wind energy simulation. This data represents the total irradation on a flat surface for every hour. To predict the sun intensity on an energy supplying object there should be calculated for every hour in a year the sun orientation and the amount of beam and diffuse irradiation. Equipment can be placed at different locations, with different angles. To calculate the hourly sun irradiation on tilted surfaces the following equation can be used: (Perino, 2013)
The separation from total irradiation on a flat surface to the direct and diffuse part will be done by using an existing correlation method. The reflectivity factor ) is dependent on the type of environment and will be between 0,2 and 0,8.
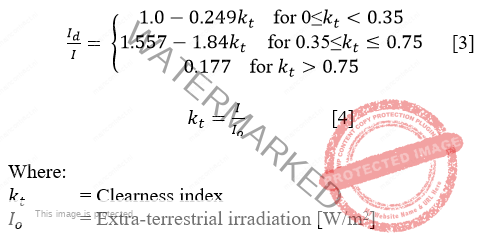
By using the hourly irradiation ( ) data obtained from local weather stations the diffuse fraction can be separated from the beam fraction using the Orgill and Hollands (1976) correlation:
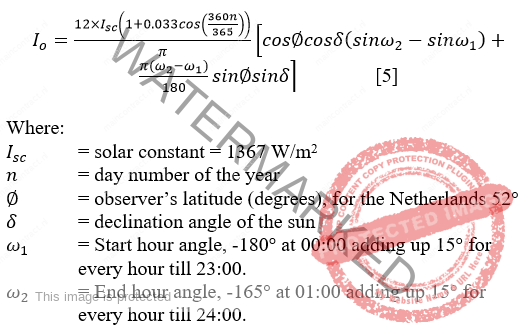
The extra-terrestrial irradiation from the sun reaching the earth atmosphere is relatively constant while the irradiation of the sun on the earth surface varies widely. To calculate the beam and diffuse fraction of the measured global irradiation on the surface the extra-terrestrial irradiation is needed as seen in the correlation mentioned above. For the calculation of the extra-terrestrial irradiation ( ) on the outer earth can be used (Basunia, Yoshiob, & Abec, 2012):
The declination angle is the angle between the earth’s equator and a line drawn from the centre of the Earth to the centre of the sun. The declination angle varies 23,45 from the equator during the year and has a seasonal behaviour. On June 21st, the declination angle will be 23,45 and on December the 22nd the declination angle will be -23,45 . To calculate the declination angle ( ) of the sun for a day, the following equation can be used: (Basunia, Yoshiob, & Abec, 2012):
The ratio is needed to calculate the amount of solar beam irradiation which could possibly reach the (tilted) surface. It is also called the geometric factor and differs continuously. It is dependent on the positioning of the observer’s tilt angle surface azimuth angle and altitude angle and the physic factors declination angle and hour angle . This results in the fraction where is the angle between the tilt angle and actual suns angle and is the sun orientation compared to the zenith of the observer. The ratio can be calculated using the following equation (ITACA, 2016): For photovoltaic panels efficiency factors of 22% are common. (NREL, 2017) However, panel temperatures influence the efficiency. The hotter the panel the lower the efficiency. As a guideline, there can be used a loss about 0,4% (Schiebaan, 2013) for every degree C. above 25 degrees C. In case of thermal panels the efficiency will be around 70% of the global irradiation.
7. Exchanged Energy
This energy source is capable to extract the thermal energy out of the ground, air, water or other materials which can be used to heat or cool the system or in some countries to translate it into electricity. For geothermal energy, there is no direct climate influence on system behaviour.
The temperature deeply under the ground is stable and therefore this source can be very useful for heating and cooling systems. Ten meters under the ground there is a stable temperature of 10 degrees C. in the Netherlands. (TNO, 2016) The Coefficient Of Performance (COP) is dependent on the inlet temperature which is about the same as the ground water temperature, in the Netherlands about 12 degrees C. (Hondeman, 2001) Depending on the type of equipment and the usage of low temperature heating and or cooling the COP index will be around 4,2 to 4,6 (Lowe, 2011). Air-source energy is comparable with geothermal energy but uses the energy in the air to supply the system with heating or cooling capacity. Compared to geothermal energy the energy source efficiency is dependent on the climate.
The temperature of the air has influence on the COP. For heating a system, the COP raises if the temperature of the outside air raises. Unfortunately, most of the time the colder the outside temperature the more energy we need and the lower the COP. To enhance the efficiency of the heat pump reuse or storage of energy can be used, as seen with the outflow of the ventilation unit delivering air with a higher temperature to the heat pump.
There are more sources applicable to extract the energy, like a river or the sea. In all these cases the COP can be used for simulation by defining the COP for every temperature. A validated full year temperature climate history of the medium is required to make it usable for simulation.
8. Energy consumption
To define the energy consumption, it is preferred to use historical data of the (previous) system if available. If this is not available there can be investigated if data can be acquired from a comparable system. For continuous flow production processes and infrastructures, the energy consumption can be predicted over time by using the equipment manufactures data. Within buildings the energy consumptions can differ more over time by day and night and seasonal effects. If accurate data cannot be obtained the last option is to predict it using standardized demand patterns in combination with an expected yearly consumption. For industrial processes the energy demand pattern can be quite constant during the year while an office uses most of the energy during working hours. By starting with a standardized pattern and adjust this to the estimated systems behaviour over time, there will be created the best behaviour prediction if accurate data is not available. There must be created patterns for average weekly consumption and over a full year to calculate seasonal effects as well. Holidays, production stops, capacity planning etc. influence the behaviour. These can be reconfigured after defining a standardized behaviour.
9. Prediction Model
There has been chosen for static simulation capabilities which means there will be used historical data instead of randomized data. Of course, multiple calculations can be executed for determining the deviation, worst case or best case scenario. There have been separated heating and cooling from electricity energy simulations. The heating and cooling simulation should be done before the electricity simulation. This is due to the dependency of electrical energy usage needed for heating and cooling. This will be used as an input for the electrical energy demand generator. Parallel can be performed the energy supply pattern generator which defines the estimated hourly percentage of energy compared to the full year, for each source. There can be used multiple sources or even more equipment setups by using the same source data. These patterns are together with the equipment efficiency needed to predict the performance over time for the different sources and/or setups. More climate data sets can be used for supporting differences in the location where the system finally will be build. New technologies can be simulated as well, if the efficiency factors are available. To make the decision which sources, and the amount of the needed sources result in the best performance, decision criteria should be provided based on the Energy Asset Policy. Different distributions for the usage of the sources can be simulated or optimum calculation software like excel solver can find the optimum automated. Included in the simulation tool is the usage of energy buffers like vessels, batteries or ground storage. This efficiency can be calculated by using universal buffer simulation included in the simulation model.
Using this architecture results in easy and fast calculation capabilities to gain fast overview on system behaviour. Changes or constraints can be easily calculated for their impact on the system.
10. Validation
Validation is needed for wind, solar and demand pattern generators due to their predicting function. They will be validated separately for every part.
Wind energy pattern generator
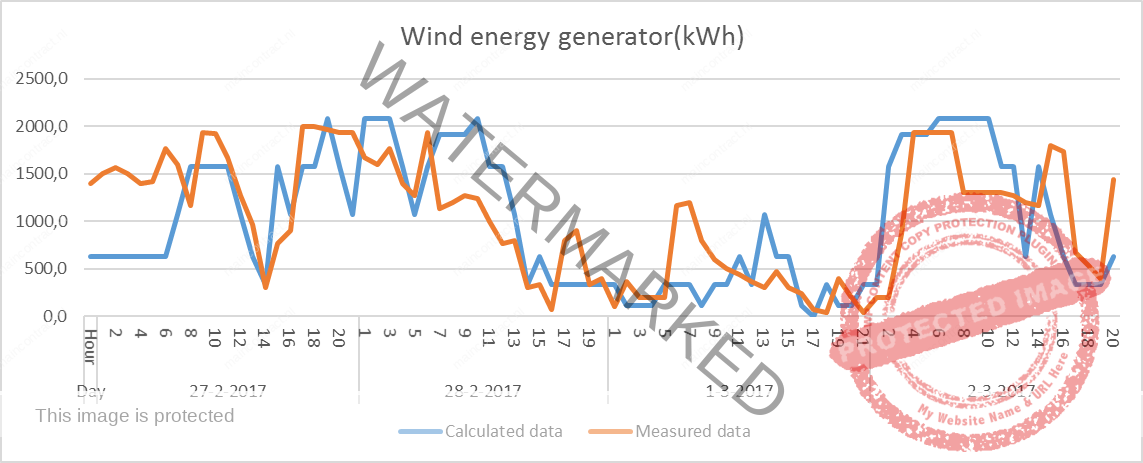
There have been obtained four days of wind energy data from a wind farm in the Netherlands. The used set of data contains heavy storm and calm weather data. This data will be used to compare the outcomes of the wind energy generator. The equipment has the following characteristics:
- Location coordinates: The Netherlands onshore (confident)
- Windmill 2 mW, rotordiameter 90 meter, centre height 105m.
- Weather station: De Bilt N 52 6.095, E 5 10.678
Graph 1: Wind energy calculated and measured data
As can be concluded from graph 1 the calculated data does follow the measured data trend, however some of the calculated outcomes differ from the reality. This is mainly caused by the chosen detail level of wind speed in combination with the efficiency factors. They are measured in steps of 1 m/s which could be better 0,1 m/s, however this data is not available from the weather stations. Sometimes the calculated data is lagging compared to the measured data. This can be the result of not measuring the climate data on the same place as the system. The total four daily deviation is about 2%, however the daily deviation is up to 23% for the first day. If the generator will be used these figures should be concerned. By measuring on exactly the right place and with a higher level of detail in measurement the data will be more reliable.
Solar energy pattern generator
To validate the solar energy pattern generator a current installed photovoltaic solar set-up will be used. There will be randomly compared hourly obtained energy data with calculated data. The equipment has the following characteristics:
- Location: Zaltbommel, N 51 48.095, E 5 14.986
- 19,6 m2 solar panel, 3,0 kW, south oriented, 20° lift
- Transformer efficiency 97,5%
- Weather station: Herwijnen, N 51 50.236, E 5 7.862
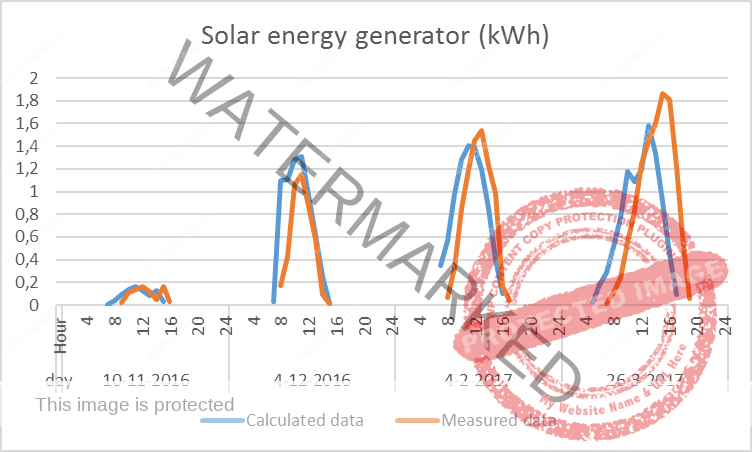
Graph 2 shows that the calculated data follows the pattern of the measured data. There is noticed a difference in the start of the day, where the calculated figures start earlier. This is not a measuring fault but is characteristic for the equipment placed on this roof.
Graph 2: Solar energy calculated and mesured data
During the sunrise, the sun is blocked by neighbor buildings which means the startup is later, and the panels are cooler during the day which results in better efficiency during hotter days. Unfortunately, this results in higher deviation values when the data is detailed to hours. For a whole year as a total, the deviation is about 3,5% for this case. For the date 4-12-2016 the deviation is about 50% which is of major concern. Solar panels are extremely sensitive to shadowing and during these days the sun comes up only just above the neighbor houses. During the spring the daily energy prediction is getting better, which means the model is performing well in normal conditions.
Energy demand generator
For the validation of the energy demand generator, data have been obtained from the SPIE office building, situated in Eindhoven. This highly sophisticated building measures the energy consumption constantly and therefore this data is very reliable. The data contains only the electricity consumption.
There have been used an ‘office weekly pattern’ in combination with a ‘flat pattern’ for the weeks spread over the year. In graph 3 has been shown the results of the calculated and measured data starting with a Monday ended on a Sunday. The deviation of the total calculated and measured data for the week is about 8%. The measured data has an earlier start-up time. This is because in the technical business employees start and stop often much earlier compared to other office employees. The standard weekly office pattern does not take this into account and therefore this should be adjusted in the very beginning
Graph 3: Energy demand calculated and measured data
![]()
11. Conclusion
During the early design phases of systems design and engineering flexible prediction capabilities are needed to guide the process. The energy sources wind, solar, extracted and grid energy should be aligned as much as possible with the energy consumption. Sources are divided into operator or environmental steered assets, because they need a different approach to make predictions of behaviour. Also, there should be separated energy needed for heating/cooling and electricity. To quantify the impact of decisions there have been described criteria for decision making which are: Investment need, Life Cycle Costs, Life cycle impact and the amount of sustainable or own energy.
To start the design and engineering process there are needed start-up criteria which should be detailed during the process. To predict the behaviour of the supply of energy sources, physical calculations are needed for wind and solar energy. They have been found in previous executed investigations. In the case of extracted energy there can be used Coefficient Of Performance figures to predict the behaviour over time. To define the expected energy consumption, it is preferred to use historical data of the system if available. If this is not available there can be investigated if data can be acquired from a comparable system. For continuous flow production processes and infrastructures, the energy consumption can be predicted over time by using the equipment manufactures data. Within buildings the energy consumptions can differ more over time by day and night and seasonal effects. If accurate data cannot be obtained the last option is to predict it using standardized demand patterns in combination with an expected yearly consumption.
After calculating the behaviour of possible energy supply sources and the consumption patterns, the prediction model will combine these components to calculate their relationship. There have been chosen to use hourly data because of the impact of fluctuating energy supply and/or consumption patterns. Storage of energy is also included in the model and can be adjusted to meet the criteria even better. To validate the prediction model there have been used data from wind and solar equipment and an office building for comparing it with the predicted data. The outcomes show that it is possible to predict the behaviour over time, however hourly predictions can have high deviations which should be considered during usage. This is due to the level of detail used in the model and climate differences between the place of the measured data and the weather station. Opportunities for higher accuracy have not been found during this investigation. Unless the prediction is not fully reliable, it is usable for guiding the early design process.
12. Acknowledgement
I wish to express my sincerely gratitude to Jan van Hoof, Manager staffing at SPIE, for making it possible to participate the master Maintenance & Asset Management and for the support during the thesis activities.
Bronnen / Referenties
Zaal, T. (2009).
Integrated Design and Engineering, as a Business Improvement Process. Hoorn: Maj Engineering Publishing.
Ouwehand, J., Papa, T., Gilijamse, W., & de Geus, J. (2005).
Toegepaste Energietechniek deel 2. The Hague: SDU Uitgevers.
Perino, M. (2013).
Available Solar Radiation. Torino: IDES-EDU.
Orgill, & Hollands. (1976).
Correlation equation for hourly diffuse radiation on a horizontal surface. Solar energy, p.357-359.
Basunia, Yoshiob, & Abec. (2012).
Simulation of Solar Radiation Incident on horizontal and inclined Surfaces. TJER 2012, Vol. 9, No. 2, 27-35.
ITACA. (2016).
The Sun As A Source Of Energy. Retrieved from ITACANET: http://www.itacanet.org/the-sun-as-a-source-of-energy/
NREL (2017).
Graph of researched PV cell efficiencies. Obtained from: https://commons.wikimedia.org/wiki/File:PVeff (rev160812).jpg
Schiebaan, L. (2013).
fritts. Retrieved from: https://fritts.nl/zonnepaneel-datasheet/
TNO. (2016).
Aardwarmte. Retrieved from Geologie van Nederland: http://www.geologievannederland.nl/ondergrond/afzettingen-en-delfstoffen/aardwarmte
Hondeman, H. (2001).
Warmtepompen in de kas. Apeldoorn: Gastec. Retrieved from https://www.kasalsenergiebron.nl/content/research/Bijlage_Eindrapport_10618.pdf
Lowe, R. (2011).
Combined heat and power considered as a virtual steam cycle heat pump. Energy policy, 5528–5534.
Corresponding author:
Thijs van den Eerenbeemt
Student commissioned and funded by SPIE: www.spie.com
Discuss or give your opinionFollow on FacebookFollow on Twitter
Related Articles
https://maincontract.nl/asset/hu-recognized-iam/
Tags: Article, Assetmanagment, Definitie maincontract, Maintenance, NEN-ISO 55000, Onderhoudscontract


