Pagina Inhoud
- Publicatie 8 Januari 2022
![]()
Condition monitoring systems are deployed in various industries for decades contributing to optimizing operational performance and maintenance efforts. Several publications address this potential for application in the offshore wind energy industry; however, none attempts to quantify the impact that longer warning times ahead of a failure would have on asset availability. The aim of this paper is to bridge this gap by considering particularly the access restrictions for offshore operations through a probabilistic model which simulates existence of different condition monitoring systems on offshore wind turbines in the time domain. Results of this study quantify the positive impact that a longer warning time of potential-to-functional failure (P-F interval) has on availability, highlighting that variation of maintenance strategy through transformation of unplanned activities into planned interventions that can be conducted during a suitable weather window ahead of a component failure can lead to reduced operation and maintenance (O&M) costs.
![]()
Author: Sofia Koukoura , Matti Niclas Scheu and Athanasios Kolois Source: Science Direct
Condition-based strategies rely on information based on data collected by continuous or periodic, online or offline CMS.
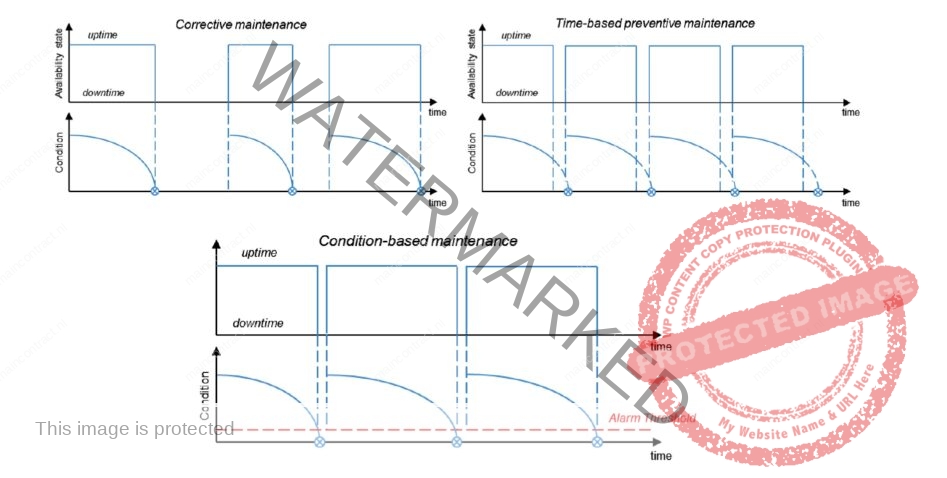
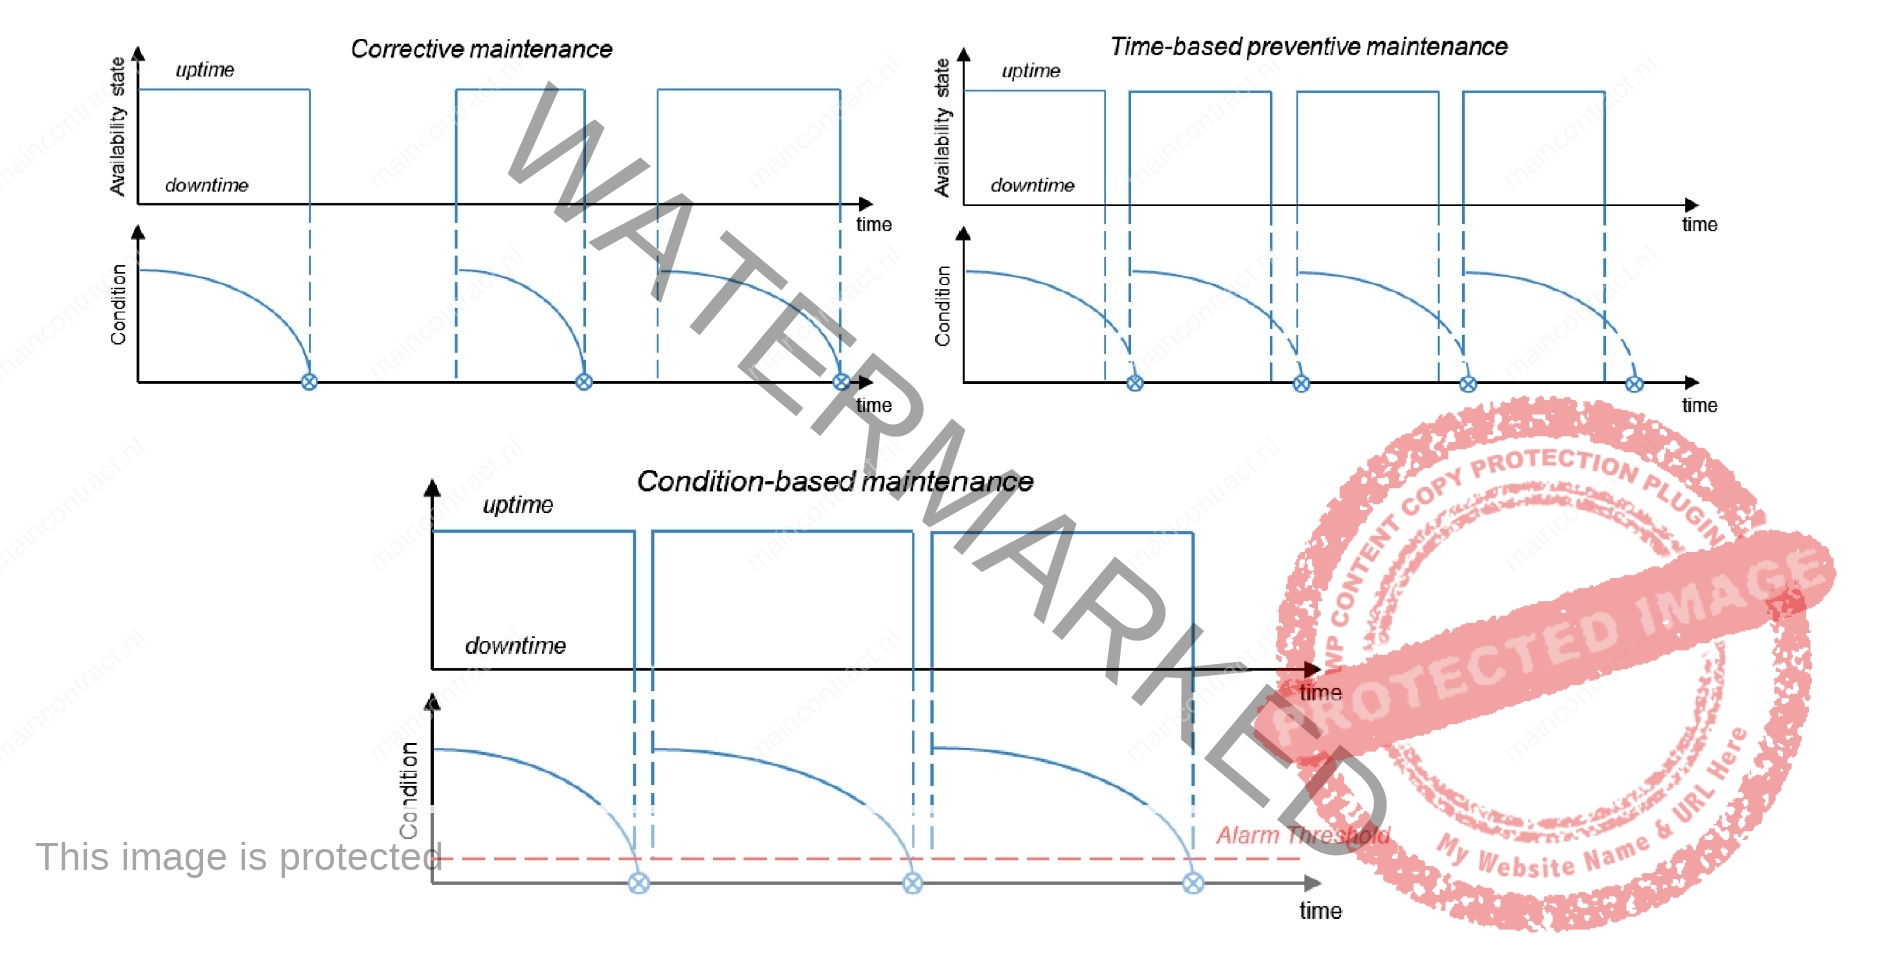
A clear distinction between diagnostic and prognostic systems becomes relevant. The following definition can be used to distinguish between the two: ‘Diagnosis is an assessment about the current (and past) health of a system based on observed symptoms, and prognosis is an assessment of the future health’. The different maintenance strategies discussed above are illustrated in a simplified, conceptual manner in order to establish understanding of the main implications.The alarm threshold in the conditionbased maintenance strategy is often set based on experience. For example, if a sensor value or a processed health indicator exceeds a limit, the alarm is activated.
The P-F Interval
In order to apply a CBM strategy, the failure behaviour, or physics of failure, of a component must be known; whereas, usually, a CBM strategy is most efficient if a developing failure can be detected well in advance. A common way to evaluate this, is the concept of P-F intervals. It describes the interval between the point in time a developing failure can be detected until the failure occurrence.As defined, a failure is defined as the ‘inability of a system or component to perform its required functions within specified performance requirements’. In a case of a wind turbine, this means that a component is not functioning and as a result a turbine is not fully operational.
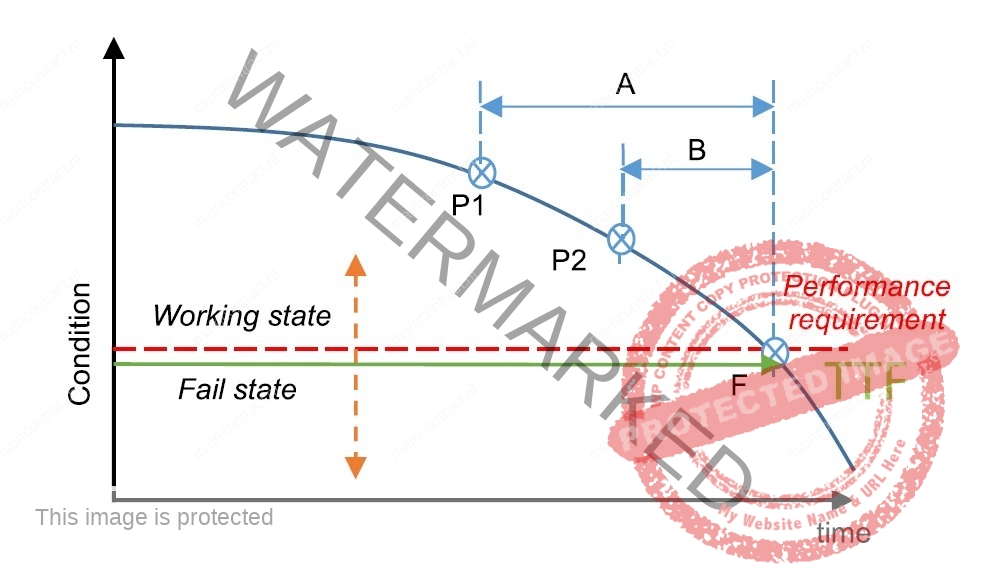
The P-F interval is therefore smaller than the lead time to failure (TTF), since the detection of the failure is fundamentally possible after the functional period has started. This is indicatively illustrated in the figure above. This example shows damage accumulation of a hypothetical component with time and according to a certain performance requirement. As soon as the performance requirement falls below a threshold, the component is in a failed state. This represents the F of the P-F interval. A and B represent CMS – in this example, A is capable to detect the failure development at time P1 and B is capable to detect the failure at time P2.
The interval between the potential failure detection (here: P1 considering monitoring system A and P2 considering monitoring system B) and the actual failure F is defined as P-F interval. In this case, system A offers an earlier warning to enable a better-informed intervention to restore its operational capability. The P-F interval is used as a performance indicator for CMS. The duration of the PF interval affects maintenance panning.
A CMS with diagnostic capability detects a potential failure and after the fault detection, it is necessary to predict the time to functional failure. The longer this interval is and the more accurately the exact point in time of failure occurrence can be estimated, the more benefits can be obtained by applying the system in a CBM strategy. Several other terms may be used to describe the P-F interval: warning period, TTF or failure development period. The P-F interval can be estimated based on experience (reliability and maintenance track records) or based on expert judgement, which is particularly the case for novel equipment. Development of this type of condition deterioration/damage accumulation curves is based on a number of experiments which should then be statistically processed, taking a conservative curve as the characteristic for the purposes of design and further support maintenancerelated decisions. While developing a maintenance strategy, the benefits of each maintenance approach should be evaluated considering the criticality of certain components and the actual benefit that monitoring brings, aiming to optimise life cycle costs and residual risks. Quantification of the benefits of monitoring in this context is the aim of this paper, hence a more extensive reference on CMS is not further included as the main focus is at supporting the understanding of the value that such systems may have in terms of increased asset availability. A methodology to quantify those benefits is presented in the next sections, followed by presentation and discussion of results.
![]()
Intermezzo The Asset Management BowTie
The recently published standard EN 17485 introduces methods and procedures about maintenance within physical asset management for all the levels and functions of the organizations’ management, including corporate planning management, plant management, technical management, production management, financial management, asset management, maintenance management, and quality management.
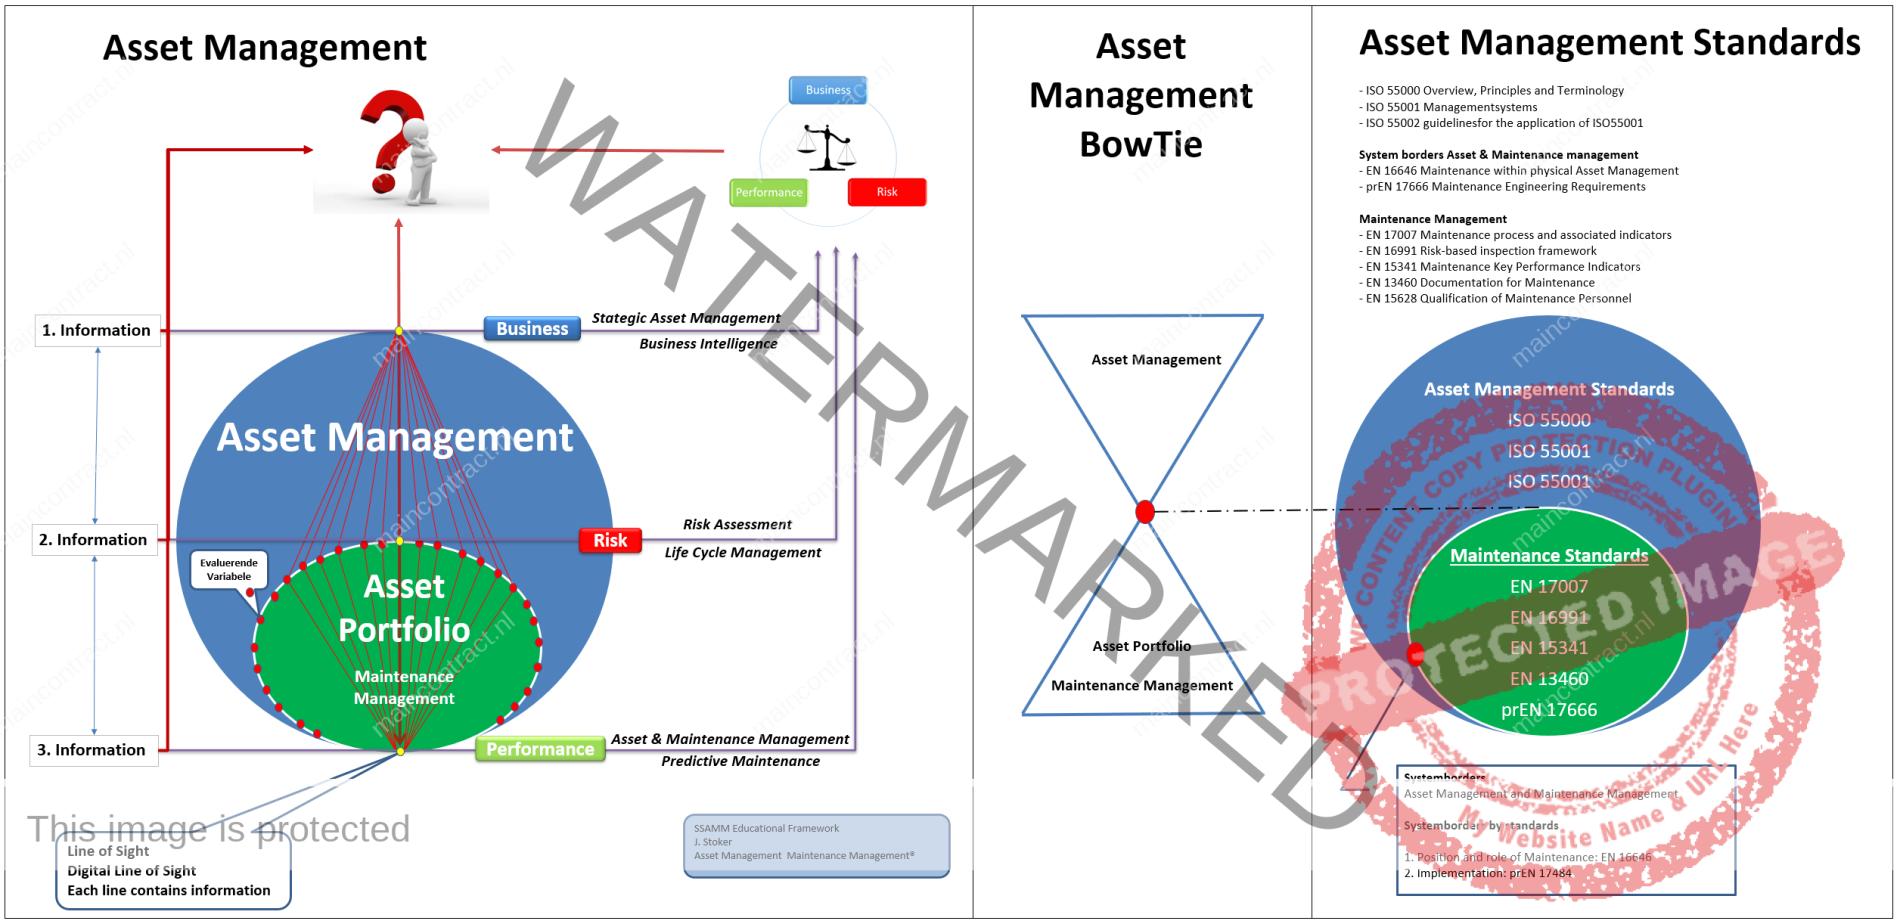
Further and maybe even greater benefits are now being found through improved credibility in the eyes of customers, regulators and other stakeholders. Physical asset management also results in much greater engagement and motivation of the workforce, and in more sustainable, continual improvement business processes. Physical asset management builds up the required link between maintenance management and the organizational strategic plan and gives direction to maintenance activities.The standards EN 16646 and EN 17485 build the bridge between ISO 5500x (Asset management system standards) and the EN maintenance standards. ISO 55001 states that organizations should determine e.g. the organizational context, requirements for the assets, decision criteria, strategic asset management plan and asset management plan (including maintenance). However, it does not describe how to do it. Respectively, maintenance standards often introduce e.g. the concept of the required function or the concept of maintenance strategy, but do not explain how they have been determined. EN 17485 introduces a methodological framework which advises organizations to implement the requirements presented in ISO 55001. By doing this it creates the bridge between the several maintenance standards and ISO 5500x in order to give an applicable starting point to the more detailed documents for the specific sub-functions of maintenance (See AM-BowTie).
This insights, the Asset Management BowTie, can be added toward the Asset Management paradigm with the (Digital) Line of Sit. To add the BowTie principle, the body of thoughts of the EN-17485 can be incorporated in the Asset Management paradigm with the mentioned standards. Result is a deepened figure 1 of the ISO5500 completed with the Line(s) of Sights, the levels of information, Business, Risk Assessment and Asset & Maintenance going to decision making in balancing Costs, Risks and Performance. The Asset Management BowTie show how standards can be uses as a reference framework.
Click to enlare Asset Management BowTie: See Body of thoughts AM-BowTie Click Here
![]()
Methodology and baseline case
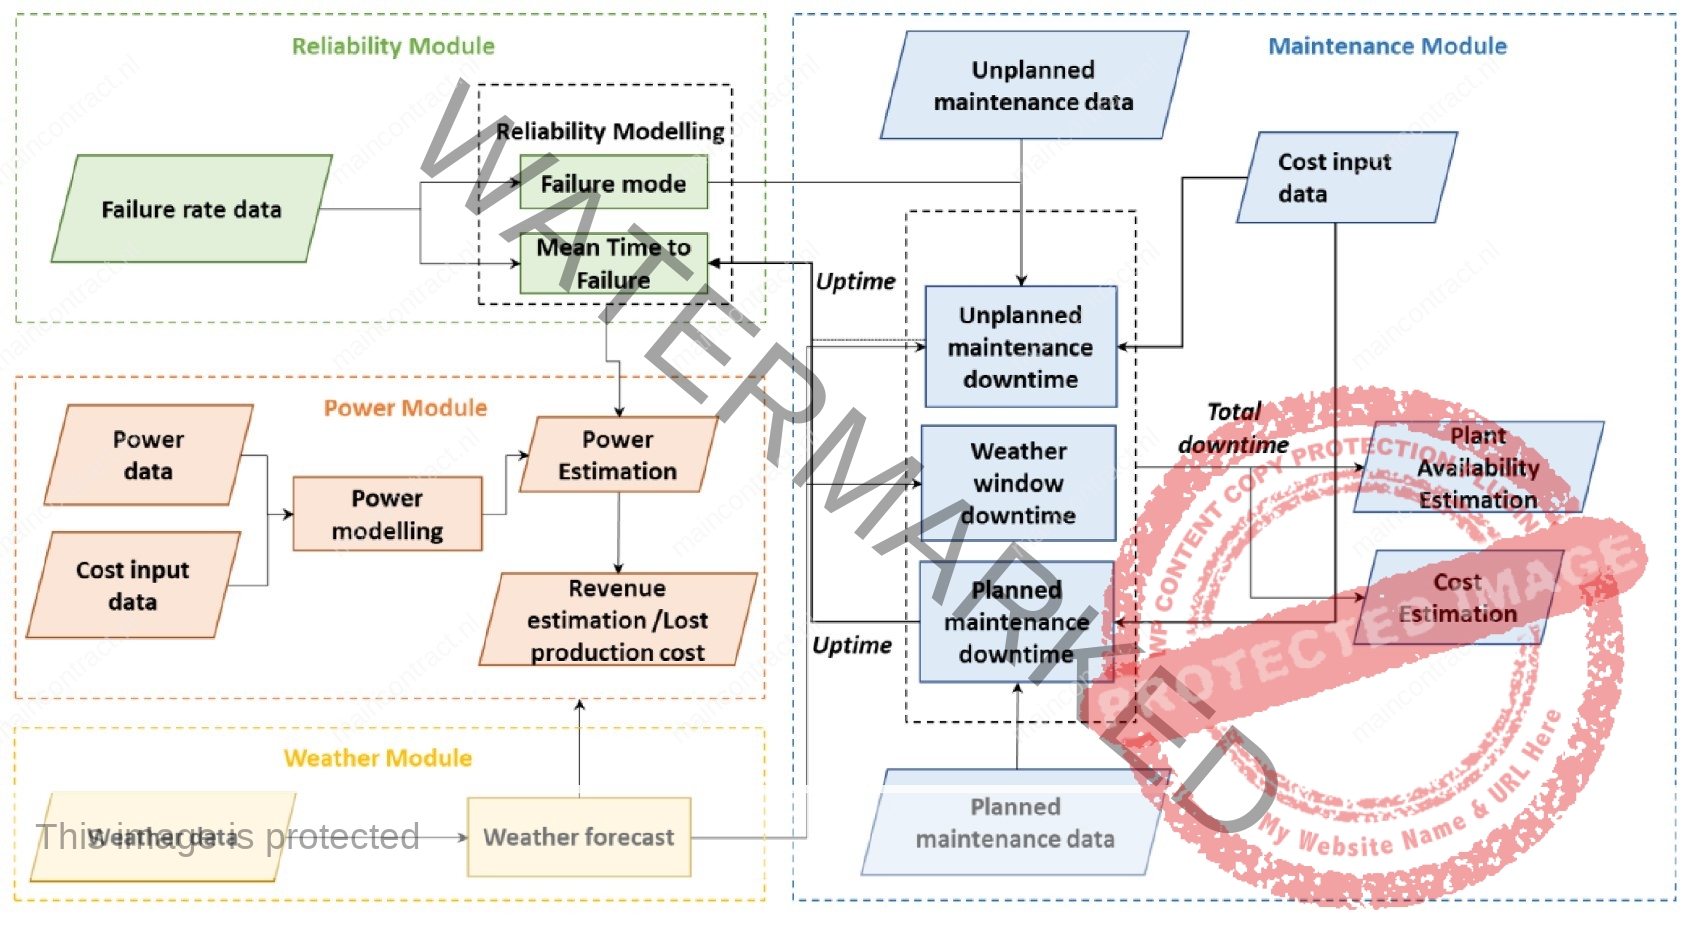
A time-based simulation model relying on Markov chains and stochastic modelling has been developed and deployed for solving the research question addressed in this paper. The model was initially programmed by the authors and had been used to assess availability ofvarious operating scenarios of current large-scale offshore wind farms.
The new tool that has been employed for this study, is capable to simulate CMS and to assess wind farm availability sensitivity related to varying P-F intervals for WT system failures. A brief explanation of the tools’ structure and individual modules is provided in the following and illustrated in the figure below, where the main focus is on a further extension for the post-processing capability that is used to analyse CMS.
Click to enlarge
Click for the full article Science Direct & Reverence papers
![]()
5. React, Discuss & Article
Discuss or give your opinionFollow on FacebookFollow on Twitter
Related Articles
Tags: Circulair


