This Article Is Replaced. Click Here for the last update
This article is not upadeted anymore. Please find the recent updated version of this article by clicking the red buttun above
The research is focused on the role of Maintenance Management as one of the four fundamental basic principals of Asset Management as defined in the NEN-ISO 55000. The reason is that the ISO 55000 Maintenance Management regarded as one of the four fundamental pillars of Asset Management. Despite the fact that the standard defines a Asset in such a way that it could be anything, it gives no insight into the structures in which Assets are composed. The research aims to provide insight into this through from the inheritance the three types of element structures (Civil, Building and Industrial Process) adding to the paradigm used by the standard and connecting the policy to the smallest Asset component. This linkage is named “The Line Of Sight” and is based on the analogy with the ” Research Onion “. The following considering describes (shortened) this insight so that the degree of influence of failure by the smallest Asset Component definable and/or quantified and is part of a number of related topics. Derived of this consideration is the SAMP/AMP, the definition of the concept Maincontracting and other related topics and objectives of the research.
- Draft Version: 17 June 2014
- Updated December 3, 2015
- Updated February 8, 2017
- Updated 23 September 2017 (version 1.0)
- Updated 23 March 2018 (Version 2.0)
Pagina Inhoud
![]()
Asset Management, we could speak of an “Asset Management Onion”. By peeling the Asset Management, layer by layer, we finally arrive at the smallest part of the asset (component) which ideally does exactly what the organization’s policy or management had envisaged during the lifetime of the component. In fact, it can only when these two are associated with each other during the lifetime of the smallest element. As long as the company policy or objective, and the smallest component but there can be interconnected “moved along” in the internal and external context of the Asset. This link is in English “Line Of Sight”, however, said in the study, “Linking policy to Maintenance Activity.” The policy prepared by linking the management of the component ** will do exactly the component for life from what is expected. In that paradigm are failures not what actually should be the way of thinking.
Author: ing. Jan Stoker MSc. MEng.
![]()
* Research ‘onion’. Source: Saunders, Lewis and Thornhill (2008)
** Component smallest particle of an asset in accordance with BS 2767 2013 version.
When Asset Management
Once an organization is responsible for Assets withing a Portfolio the organization is engaged in Asset Management with the objective create value. Value comes in many forms and can be anything; financial, material, service, estetical, monuments, cultural etc etc. It may be that achieving up-time for example, a data center of the organization is the most important, or producing the most liters of beer, or just the most liters of beer at the lowest possible costs and still achieve the up-time at the lowest energy consumption. But also a pleasant stay, enjoying a safe working environment, the ins tooth like ruins or circular realizing Assets is value creation. It is, thus, to create Assets their value to the organization and its stakeholders. These does not matter what it is an asset. As an asset represents a value can be anything. An asset is a thing, or an entity that has a potential value or actual value. Abstract shapes as knowledge, people, skills, competences … but also buildings, installations in these buildings are also value.
Bron Youtube
Bron Youtube
Bron Youtube
P-F interval Condition related to Lifecycle’s of Assets; ISO55000 Based
1. Paradigm, Conceptual model and theoretical framework
Various institutes defining and formulating views and visually displaying the Asset Management landscape and content. Most well known are the Institute Of Asset Management (IAM) and the Global Forum On Maintenance & Asset Management ( GFMAM ) which works closely with the European Federation of National Maintenance Societies ( EFMNS ) who, for example, defines the competence of the ‘Maintenance Manager’. The Institute of Asset Management (IAM), for example, defines the Asset Management landscape in a conceptual model for the purpose of describing the whole of Asset Management framework. The landscape is divided into six topics that run through 39 processes. The first edition of this landscape was published in Asset Management – An Anatomy November 2011, the second edition was published in March 2014 and the third edition was published in December 2015 (Institute of Asset Management, 2015).
![]()


![]()
The researches sets the NEN-ISO 55000 as a theoretical framework and demarcates responsibility in the situation that the Technical Management and Maintenance based on a system boundary. This system boundary demarcates where the property begins or where the responsibility starts. The research considers the inheritance as the system boundary to include all types of components and element structures of the three basic element structures of Civil, Building and Industrial components.
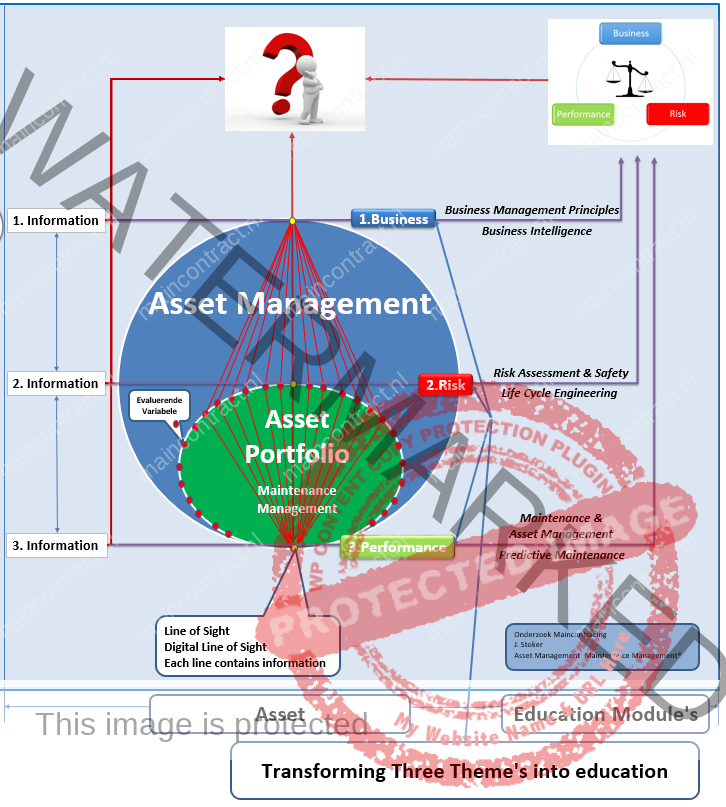
An abstract example is shown in Figure 1 and considered from the system boundary “see” we two phenomena, namely: The Asset and his second of four pillars “Reconciliation” in which the Technical Management & Maintenance in operating under. In the figure this is represented by placing “Alignment” within the asset management so that Alignment is a part of the Asset Management. In this approach Alignment becomes an integral part of the Asset Management moves along with the circumstances,
This approach implies that there is a connection between the framework (Strategic Asset ManagementPlan and Asset ManagementPlan) which is imposed on the asset management and the smallest part. This connection is represented in the figure by an line and two yellow points that, respectively, the purposes of the asset management and represent the smallest part. This link is “The Line of Sight” or as part of the research “Linking Policy to Maintenance Activity.” The intersection such as that shown in Figure 1, as well as the actual separation between the Asset Management and Technical Management and Maintenance where these are defined as:
- The Asset Management: coordinated all activities of an organization to realize value from Assets.
- The Technical Management & Maintenance: Combination of all technical, administrative and managerial actions during the life cycle of an item intended to preserve or restore in a state where it can perform its required function.
The intersection demarcates the framework the Technical Management and Maintenance has to comply. It specifies, based on the variables for example, what the risks are if components or elements failing , what competencies are required by maintenance employees, what level of service should delivered or how to deal with the lifetime of elements.
1.1 Evaluating Variables
Where the Institute of Asset Management the thirty-nine subjects spread over in six “subject-groups” the research have a different point of view. The research regarded as any variable affects the function and / or performance of the smallest Asset Component. As shown in Figure 1 are located at the intersection of the Asset Management and Technical Management and Maintenance of the variables that influence both within the Asset Management and / or the smallest part of the asset. These variables are represented as red spheres on the intersection (system boundary) between Asset Management and Technical Management and Maintenance. The red spheres are the Evaluating Variables and are stand-alone variables and their impact on the smallest part of the asset are either prerequisite check that smallest part. These may be variables like risk, asset management plan or competence and are defined in the NEN-ISO 55000. By placing all the variables in the intersection line there is a framework of each variable that influence the function or performance of the component.
Table 1 shows which variables are and are located at the interface between the Asset Management and Technical Management and Maintenance. These 39 (thirty nine) variables that affect the smallest part of the asset.
2. Analogy: The Research Union
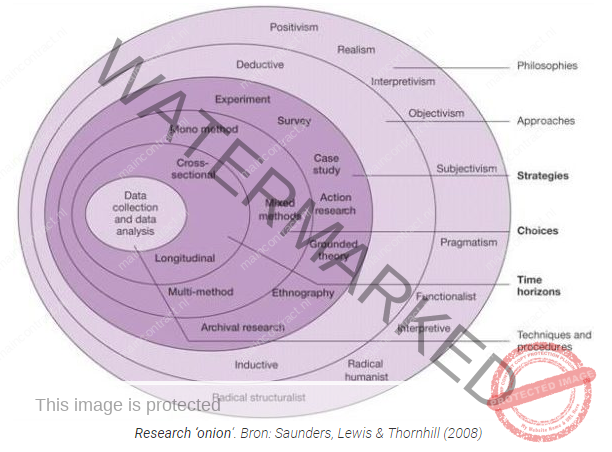
Figure 1 represent in an abstract view the Asset Management and Technical Management & Maintenance. Figure 1 shows the subjects Asset Management and Technical Management and Maintenance appears. In this case, the asset management appears which includes the Technical Management and Maintenance and are therefore inextricably linked in this view. To each subject can be added to a subject again, so that there are several “layers” emerge from which the framework is built up.
Such displays have an analogy with the “Research Union” of Sounders, Lewis and Thornhill *. Based on the different layers of the research union science is gained to get insight into the underlying issues that lie at the basis of this methodological choices. The research interprets the research onion and the way in which the NEN-ISO 55000 explains the relationships between terms, as an analogy, and uses this as a starting point in order to add the various layers to the subjects from which the asset management is built up. The aim is to “peel” the Asset to the smallest component to define as different layers and achieve a conceptual model.
* Sounders, Lewis & Thornhill 2003, Methods of research p.86
2.1 The Asset Management layers
The NEN-ISO 55000 denotes the hand of terms and definitions, the relationship between the different subjects. The NEN-ISO 55000 does this have been recorded on the basis of a framework in which different “layers”.
An example of this is Figure 3 of the standard in which four threads are interpreted that have a relation to each other. It is :
- The management of the organization
- Asset management
- Asset Management System
- Asset Portfolio.
This approach has an analogy, however, the standard provides the research union out three major components that indicate the different layers. These are :
- Visualization of linking policy to Maintenance Activity
- The structure of the Asset portfolio
- The smallest part of an Asset Portfolio
3. Connecting “Policy with Maintenance Activity”
The link “Policy on Service Activity”, also known as the Line of Sight is an important part of the Asset. The coupling represents that the smallest part its functional performance in the extension of the policy provides delivers its function and performance. Conscious is spoken of here about function and performance.
Is meant that the smallest part of the Asset carries out its function, which may be, for example, ensuring that water flows, cooling takes place, heat is transferred, or otherwise. In performance it is meant that the component in addition to its function, this is also within a specified standard to take place, for example, with an up-time of 360 days a year, or a quality range of 5% depending on whether the delivered product.
It is envisaged that an organization worth successful and remains in the objectives. Think of making a profit, producing products of a certain quality or to achieve a certain level aesthetics.
3.1 Connecting variables to components
Achieving objectives or success in achieving organizational objectives or achieving policy. This can only take place if components (elements and components) provide their functions and their performance as intended. That means that the variables that affect it should be marked or create the conditions to achieve these goals. The figure below represents this situation and give in three steps how the smaller part is attached to the policy.
![]()
Figuur 4 : Click to enlarge
![]()
3.1.1 Deepening ‘The Line of Sight’
In Figure 4.3 the connection is shown between policy and components. In this view, connecting the thirty-nine (39), variables of Table 1, the policy and the component. As indicated in chapter one is the ‘Line of Sight’ visualized by the two yellow dots representing the policy respectively, and component and are connected by “The Line of Sight.” Present question is what variables or topics include the ‘Line of Sight’. Because of this, the thirty-nine (39) evaluating variables to use in section 1.1 of the interface between the system and the Asset Management Sub-System Technical Management and Maintenance 39 coupled evaluating variables between the policy component.
In this view of the “Line of Sight” is not a “line of sight” but there are actually thirty-nine 39 ‘Line of Sight’s’ that affect the component but also influence each other.
This approach variables can be quantified individually and aggregated as such one value so that a statement can be made about the quality of the Asset Management and Technical Management & Maintenance as a whole.
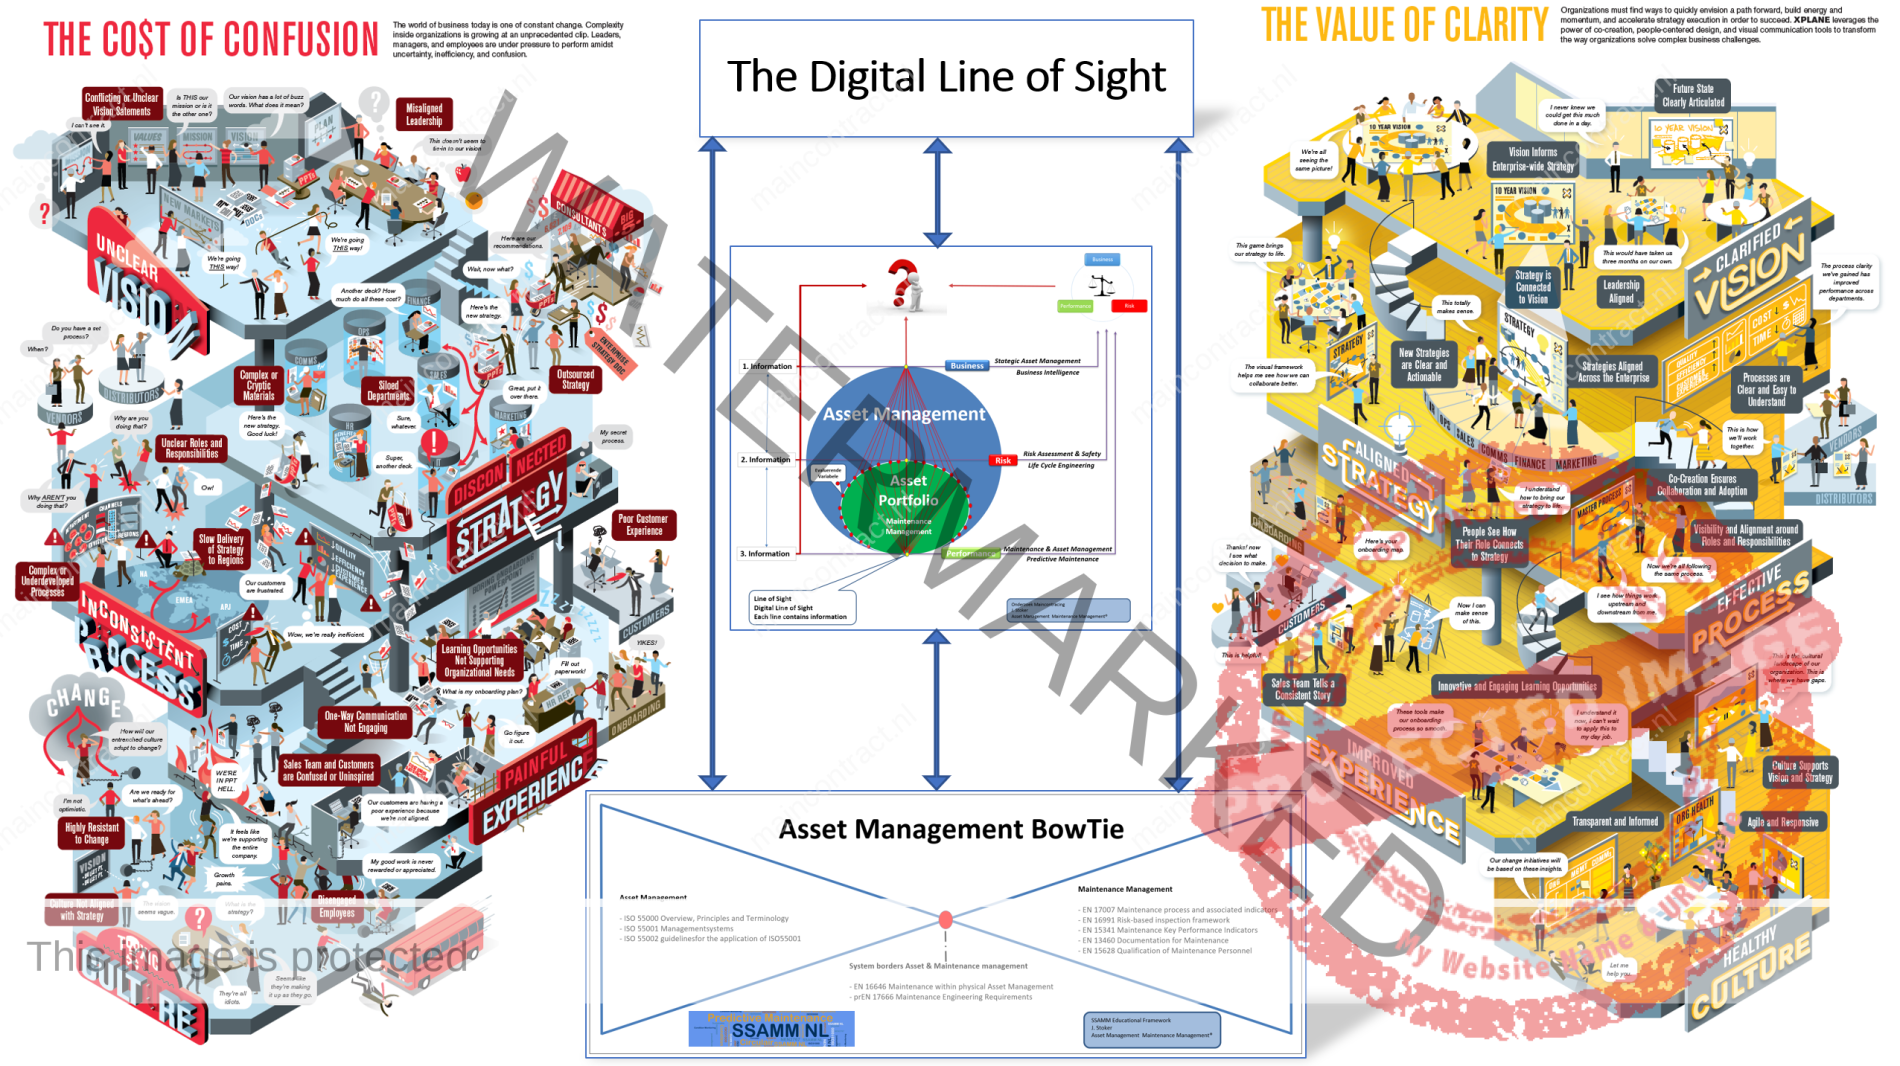
Figure Line of Sight : Click to enlarge Credits to XPLANE Click Here
3.2 Deepening the Asset portfolio, Asset and Assetype
In the previous section explained how the policy is linked to the smallest part of the asset. This abstract representation is only shown two topics that play, namely the Asset Management which defines under which the Maintenance Management must comply and the Maintenance Management which has to ensure that the part of the asset produces its function and performance.
When the Venn diagram to be translated from the previous section to an Asset Portfolio demarcated by a boundary (system boundary) with within the system boundary three groups of elements ( Civil, Build and Industry * ), this can be represented as a practical situation in the figure 5.
![]()
Figure 5 : Click to enlarge
![]()
In this figure, “sees” the observer standing on the boundary (system boundary) from point ‘A’ actually three types of element structures with all their components. These are the civil engineering elements starting from the boundary to the building, the Housing and elements of the building (building) itself and the industrial elements of the process that inside that building what actually happens to the primary process. Below is the asset portfolio briefly described each element type.
*Terminologie afgeleid van Centraal Bureau Statistiek (CBS) Standaard Bedrijfsindeling (SBI) 2008 versie 2018. Klik Hier
Standing on the boundary civil engineering elements include the building element) and the process (Industrial Elements) what is happening inside the building. This is not necessarily the case because not every industrial process has to take place within a building. With this element structures are provided for all of the elements between the gate and the building. Think of areas, green (grass trees), roads and everything below ground level at the ground of facilities to operate the asset.
To decide on the technical quality may refer to the element structure of the NEN 2767 are used and the method NEN 2767.
Within (or on) the civil engineering elements of the Build elements are placed. The Build members are the buildings or structures in which the (industrial) play process.
To decide on the technical quality may refer to the element structure of the NEN2767 are used and the method NEN 2767.
Inside the building or structure if present will the (industrial) process instead. This process can be anything such as producing goods or providing services.
In order to be able to make a judgment is above functional decomposition is applied to the technical quality, so that the elements and components can be defined.
Among other things, failure probability calculations, the technical quality of its adoption of the process so under the “opportunity” can be fixed at the risk of failure and determine what action should be taken.
When the Venn diagram of Figure 5, which the civilian elements, elements of the building and the elements of may be incorporated include the industrial process as elements of which Asset Portfolio in Figure 3 is built up, the Asset Management be considered as a whole. In this “holistic” approach, the Asset management consists dispensed from about 8 layers of the System Asset Management and the (technical), elements of which the sub-system exists, and in which “Maintenance Management ‘is applied.
The layers are shown in Figure 6. In this approach will find an integrated Asset Management rather than to all the elements that fall within the Asset Management system.
- Managing the organization
- Asset Management
- Asset Management System
- Asset Portfolio
- Civil elements
- Build Elements
- Industrial Elements
- Component
Further deepening can take place by terms and methods from Civil, Buils and Industrial process in the sub-system of the Venn diagram. When this is done is created Figure 6. In this figure, floor takes place of the asset portfolio, and in fact are per layer coupled to the variables to the smallest component. Each layer includes an environment in which the smallest part is located and where the policy through the variables establishes the framework and / or influences. In the following representation (Figure 7) are the System Asset Management and the Sub-System Maintenance Management displayed in different layers on a number of levels containing the coupling of the policy to the smaller part and the variables.
![]()
Figure 7: Click to enlarge
![]()
Figure 1: Figure 7.1 shows a plurality of layers from which the asset management is built up with two yellow bullets indicated therein, namely: the policy framework, and as a starting point for all the targets and the smallest part of the Asset. The figure shows eight layers on how the organization is built around the portfolio and the manner in which the portfolio is built up.
Figure 2: Figure 7.2 shows as in Figure 3.1 illustrate the correlation between the smallest part, however, the policy and now with connection and the variables that lie at the interface between the organization and the portfolio which must be maintained.
Figure 3: In Figure 7.3, all variables are associated policies to the smallest component. This view can be traced to different variables affect the smallest part through the various layers of the Asset Management of Assets.
3.3 Life cycles and lifespan within the system Asset Management
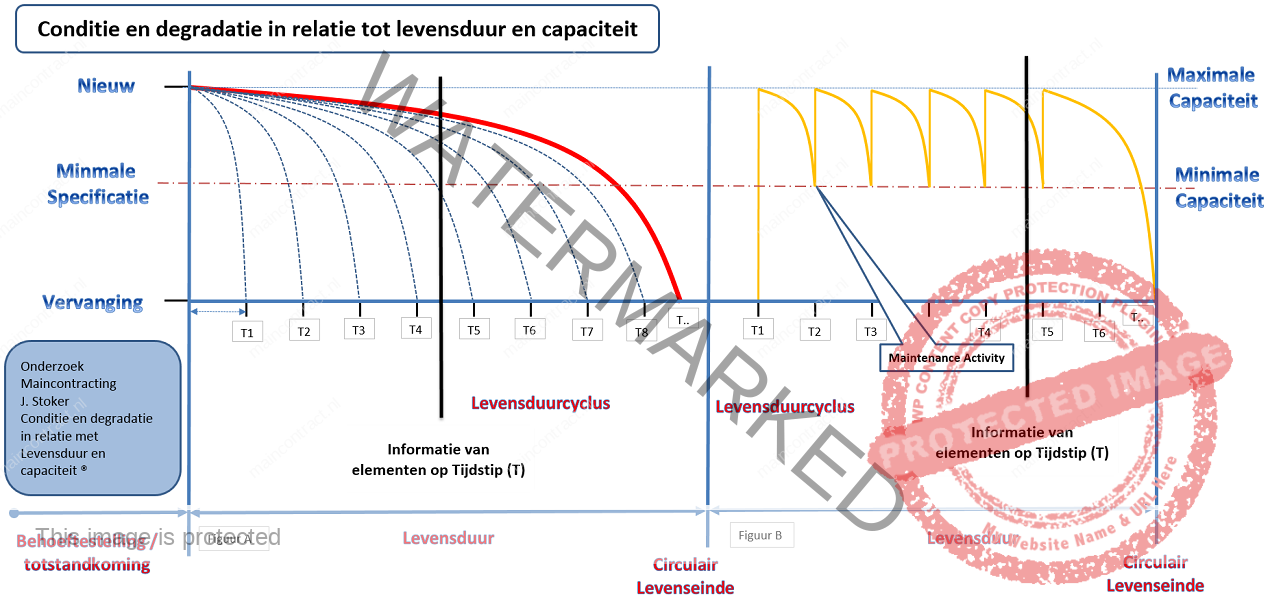
For Asset Management within the boundary as a whole or would fully apply the elements within the sub-system maintenance management in an unambiguous manner judged on their technical quality (condition), operation and performance. The importance unambiguously elements of different groups of elements (Civil, Build and Industry) is integral to rule on the technical quality of the asset as a whole. To be able to achieve it at any time “T” during the lifetime of an asset in the life cycle than the result of the technical evaluation must be the same type of information with clear outcome as shown below lifetimes Assets which are composed of Civil, Build and industrial elements.
![]()
![]()
For Civil and Build are the first steps to put in order to get a clear assessment of the technical quality of components by BS 2767 so as to include that it is applicable to both structures element. In theory it is possible that the outcome of a NEN2767 inspection of civil engineering and Build elements in the same way interpreted, and if possible, may be aggregated into a single result that represent the technical quality of the civil engineering and Build elements. Unfortunately, complementing industrial elements with the Civil and Build is not possible where the Civil and Build do succeed.
This is because the NEN2767 a qualitative analysis of the technical quality and not necessarily of performance analysis takes place and the performance despite the standard parts that make a statement. Unlike the industrial process where it is common to set the probability of failure fixed deterministic or probabilistic component level and that the degree of technical quality on the base such as using Weibull analysis.
The weibull analyse can rule on the probability of failure of systems and / or subsystems or whatever type of element structure is analyzed. The Weibull may be a possible solution direction to provide the information from the NEN 2767 inspections in a uniform manner from information on failure probabilities so that information on the elementary level is comparable.

Reliability specialists often describe the lifetime of a population of products using a graphical representation called the bathtub curve. The bathtub curve consists of three periods: an infant mortality period with a decreasing failure rate followed by a normal life period (also known as “useful life”) with a low, relatively constant failure rate and concluding with a wear-out period that exhibits an increasing failure rate. This article provides an overview of how infant mortality, normal life failures and wear-out modes combine to create the overall product failure distributions. It describes methods to reduce failures at each stage of product life and shows how burn-in, when appropriate, can significantly reduce operational failure rate by screening out infant mortality failures. The material will be presented in two parts. Part One (presented in this issue) introduces the bathtub curve and covers infant mortality and burn-in. Part Two (presented in next month’s HotWire) will address the remaining two periods of the bathtub curve: normal life failures and end of life wear-out.
The bathtub curve does not depict the failure rate of a single item, but describes the relative failure rate of an entire population of products over time. Some individual units will fail relatively early (infant mortality failures), others (we hope most) will last until wear-out, and some will fail during the relatively long period typically called normal life. Failures during infant mortality are highly undesirable and are always caused by defects and blunders: material defects, design blunders, errors in assembly, etc. Normal life failures are normally considered to be random cases of “stress exceeding strength.” However, as we’ll see, many failures often considered normal life failures are actually infant mortality failures. Wear-out is a fact of life due to fatigue or depletion of materials (such as lubrication depletion in bearings). A product’s useful life is limited by its shortest-lived component. A product manufacturer must assure that all specified materials are adequate to function through the intended product life.
Note that the bathtub curve is typically used as a visual model to illustrate the three key periods of product failure and not calibrated to depict a graph of the expected behavior for a particular product family. It is rare to have enough short-term and long-term failure information to actually model a population of products with a calibrated bathtub curve.
For further reading Click Here
Bron : Weibull.com
4. Influence and effect components towards policy
In figuren 6 en 7 wordt weergegeven hoe het beleid is gekoppeld aan het kleinste onderdeel. Figuur 6 wordt voor het onderzoek als paradigma gebruikt en tijdens de kennisoverdracht de “Asset Management Ui” genoemd door de analogie met de Research ui.
Beoogd wordt met dit paradigma een mogelijke voorstelling te maken van het Asset Management en het portfolio wat daardoor wordt omvat.
Het doel is de relatie tussen beleid en kleinste onderdeel te duiden die in de weergave als één richting wordt beschouwd maar feitelijk twee richtingen zijn, nl :
- Kaderstellend aan het Maintenance Management (Boven naar Beneden)
- Invloed op het beleid (Benden naar Boven)
4.1 Framework
Arguing with frame means that the policy under, which includes the Maintenance Management to meet. The framework is often documented and is trapped in organizational structures, processes and explicitly named in the ISO 55000 in the triptych:
- Asset management
- Strategic Asset Management Plan
- Asset Management Plan
In accordance with the definition of the asset management, which is defined in accordance with the NEN-ISO 55000 as:
Asset Management
Coordinated activity of an organization to realize value from assets
- Note 1 to entry : Realization of value will normally involve a balancing of costs, risks , opportunities and performance benefits.
- Note 2 to entry : Activity can also refer to the application of the elements of the asset management system.
- Note 3 to entry : to entry: The term “activity” has a broad meaning and can include, for example, the approach, the planning, the plans and their implementation.
Asset management is aimed to operate that part of the organization so that the framework to create value is actually made. This means defining and formulating the framework that lays down which services are to be provided by the asset functions.
In accordance with the definition of the SAMP, which is defined in accordance with the NEN-ISO 55000 as:
Strategic Asset Management Plan**
Documented information that specifies how organizational objectives are to be converted into asset management objectives, the approach for developing asset management plans, and the role of the asset management system in supporting achievement of the asset management objectives
- Note 1 to entry : A strategic asset management plan is derived from the organizational plan.
- Note 2 to entry : A strategic asset management plan may be contained in, or may be a subsidiary plan of, the organizational plan.
The SAMP is a document for the entire portfolio. The SAMP objectives are concretely defined by the organization to develop strategies so that activities can be operationalized
In accordance with the definition of the asset management plan that is defined in accordance with the NEN-ISO 55000 as:
Asset Managementplan
Documented information that specifies the activities, resources and timescales required for an individual asset , or a grouping of assets, to achieve the organization’s (3.1.13)asset management objectives
- Note 1 to entry : The grouping of assets may be by asset type, asset class, asset system or asset portfolio.
- Note 2 to entry : An asset management plan is derived from the strategic asset management plan.
- Note 3 to entry : An asset management plan may be contained in, or may be a subsidiary plan of, the strategic asset management plan.
The Asset Management Plan is an extension and deepening of the SAMP and is described specifically what is expected of the individual asset.
** Source: ISO 55000; The author thanks the NEN for his permission to publish the terms and definitions of the used standards
4.2 Impact on Policy
At the moment Asset Management, Strategic Asset Management Plan and Asset Management Plan are formulated implies even so that the functional and performance requirements of the smallest part of the asset are defined.
Maintenance Management it selve is focused on during the time the asset management this requires that parts of the asset fullfill the functional specification and performance. In this situation, objectives are fully achieved by the organization. This situation can be represented as a situation where failures does not exist and so there is no downtime, no distortions that reduce the profit or increase risks and asset components complete their life cycle. The ideal situation.
Unfortunately, this is a theoretical view and not reality. The reality is that Asset parts will fail and thus affect the objectives. Not performing in accordance with the policy means that the policy is undermined by risks whatsoever as a result.
There are several different types of impact or failures that can affect the policy. The most well-known is the downtime as a part of the Mean Time Between Failures (MTBF) when it comes out of pre-defined values. MTBF refers the mean time the asset is available to create value. A simple representation of MTBF is shown in the following figure in which the asset creates value at the time that this “Up” and no value delivering if it is “Down”.
Sources :
- NEN-ISO 55000 Asset Management – Overview, principles and terminology
- NEN-EN 13306 : Maintenance Terminology
- NEN-ISO Guide 73 , Risk Management – Vocabulary
- NEN-ISO 31000 Risk management Principles and Guidelines
- NEN-ISO / IEC 31010 Risk Management – Risk Assessment Techniques
- NEN-ISO 37500 Guidance on Outsourcing
- NEN- EN 13460 Maintenance – Documentation for Maintenance
- NEN- EN 16646 Maintenance – Maintenance within physical Asset
- Bibliography : Click Here
The author thanks the NEN for his permission to publish the terms and definitions of the used standards.
There are also other examples when MTBF is not an issue. Think of for example monumental objects, ruin’s or monumental cityscap’s who actually provide no production but contribute significantly to value creation. This (secondary) value creation occurs through the processes taking place around such asset types and / or only have the right to exist by the presence of these asset types.
For the explanation of the “Line Of Sight”, according to the paradigms as shown in the paragraphed 3.1 and 3.2, this is considerd from failing Asset parts where MTBF are present. The direct linking of the policy to the smallest component affects the MTBF policy and thereby affect respectively :
- Asset management
- Strategic Asset Management Plan (SAMP)
- Asset Management Plan (AMP)
The MTBF affected the Asset Management by the coordinated activities of an organization to realize value apparently did not comply or fail unless the MTBF foreseen or calculated. These are specific to the “coordinated” activity nearby the asset of an organization which, for example costs and benefits or risks and finances are not balanced.
The MTBF influenced and / or undermined the Strategic Asset Management Plan (SAMP) of the Asset Portfolio’s because the (documented) information on which the SAMP’s are based is not constant in the situation that the MTBF is different than anticipated. As a result, organizational objectives are not achieved, and are Asset Management Plan defined incorrectly.
Most tangible impact the MTBF of the Asset Management Plan. Failure has direct effect on the individual Asset or Asset group making the asset management objectives or not be achieved in part. An individual asset can be a building or group of buildings that fail to function or performance which makes the value creation stagnates in any form.
Discuss or give your opinionFollow on FacebookFollow on Twitter
Related Articles


